
In 2017, The Document Foundation has announced the availability of a Dashboard, based on data gathered from several development-related repositories. It is a very useful resource for marketing, as it can be configured to provide either an overview of the project or several detailed charts which can be used to get a more precise picture of what has happened in term of commits, committers, organizations, and issues. The time span covered by the dashboard can be set by the user, from days to years.
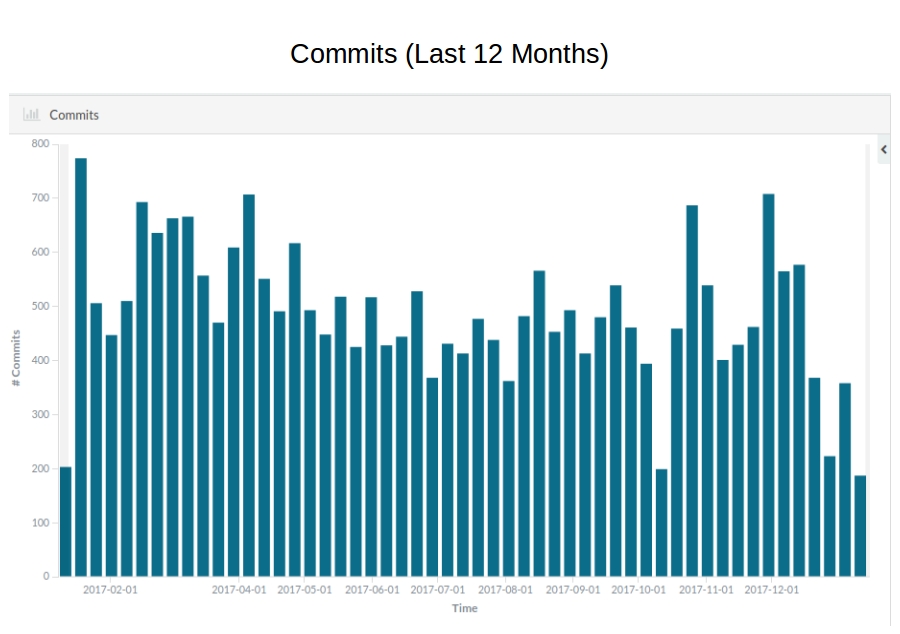
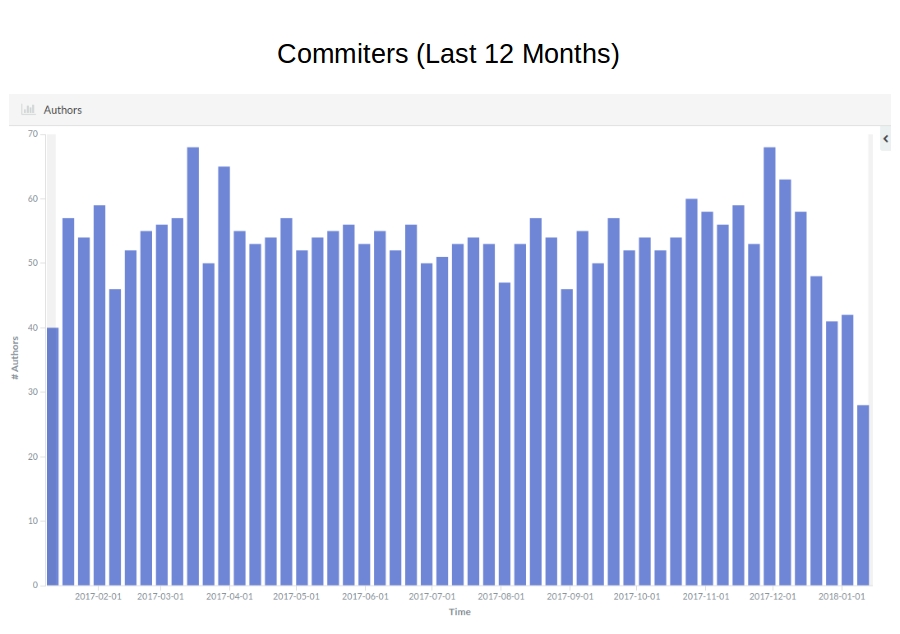
 The three histograms show trends related to commits, committers and organizations during the last 12 months (clicking on the thumbnails will open a large image, easier to read).
Commits and committers show a rather stable trend, which confirms the maturity of the project. The very few lows in commits are either seasonal or related to the LibreOffice Conference, when core developers are spending most of their time on knowledge sharing rather than on code hacking.
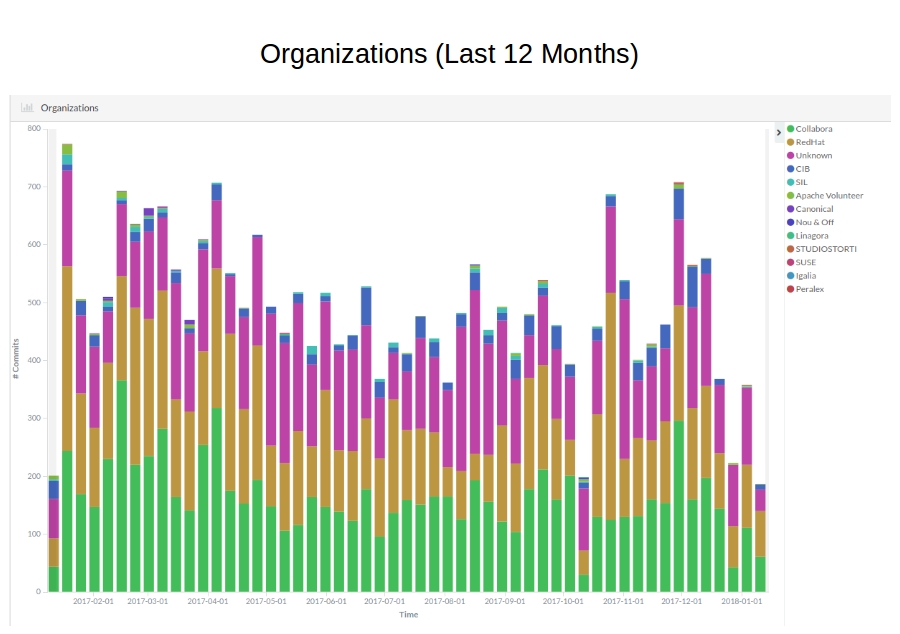
The organizations’ histogram adds the affiliation bit to commits. Collabora, Red Hat and independent volunteer developers (marked as “unknown” in the legend) are the three largest group of contributors, followed by CIB and SIL. Of course, we would like to see more contributions from developers paid by large organizations deploying LibreOffice for personal productivity.
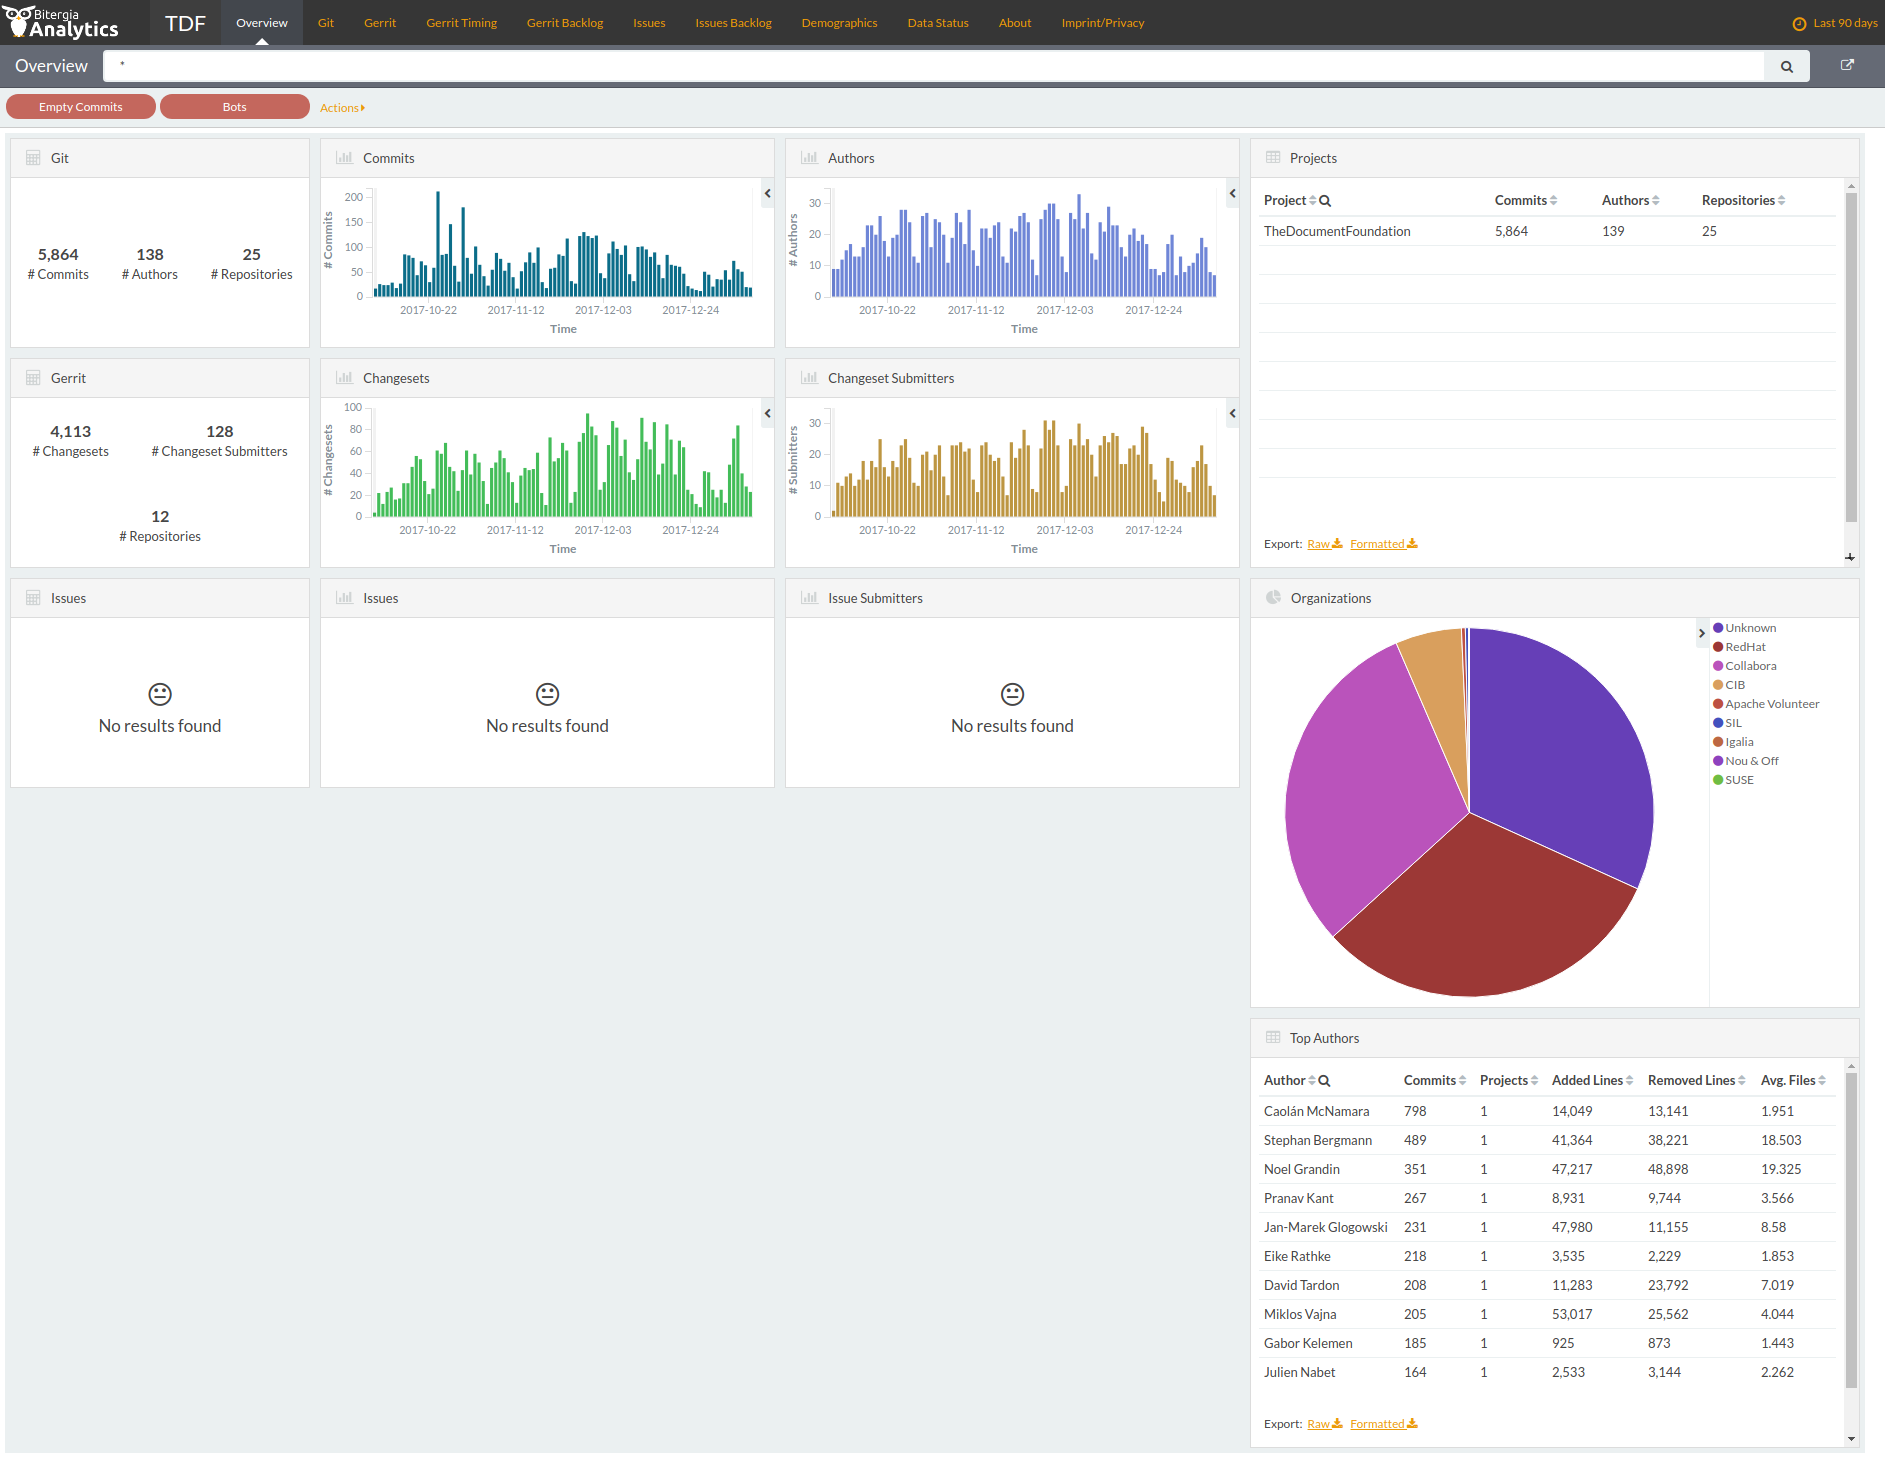
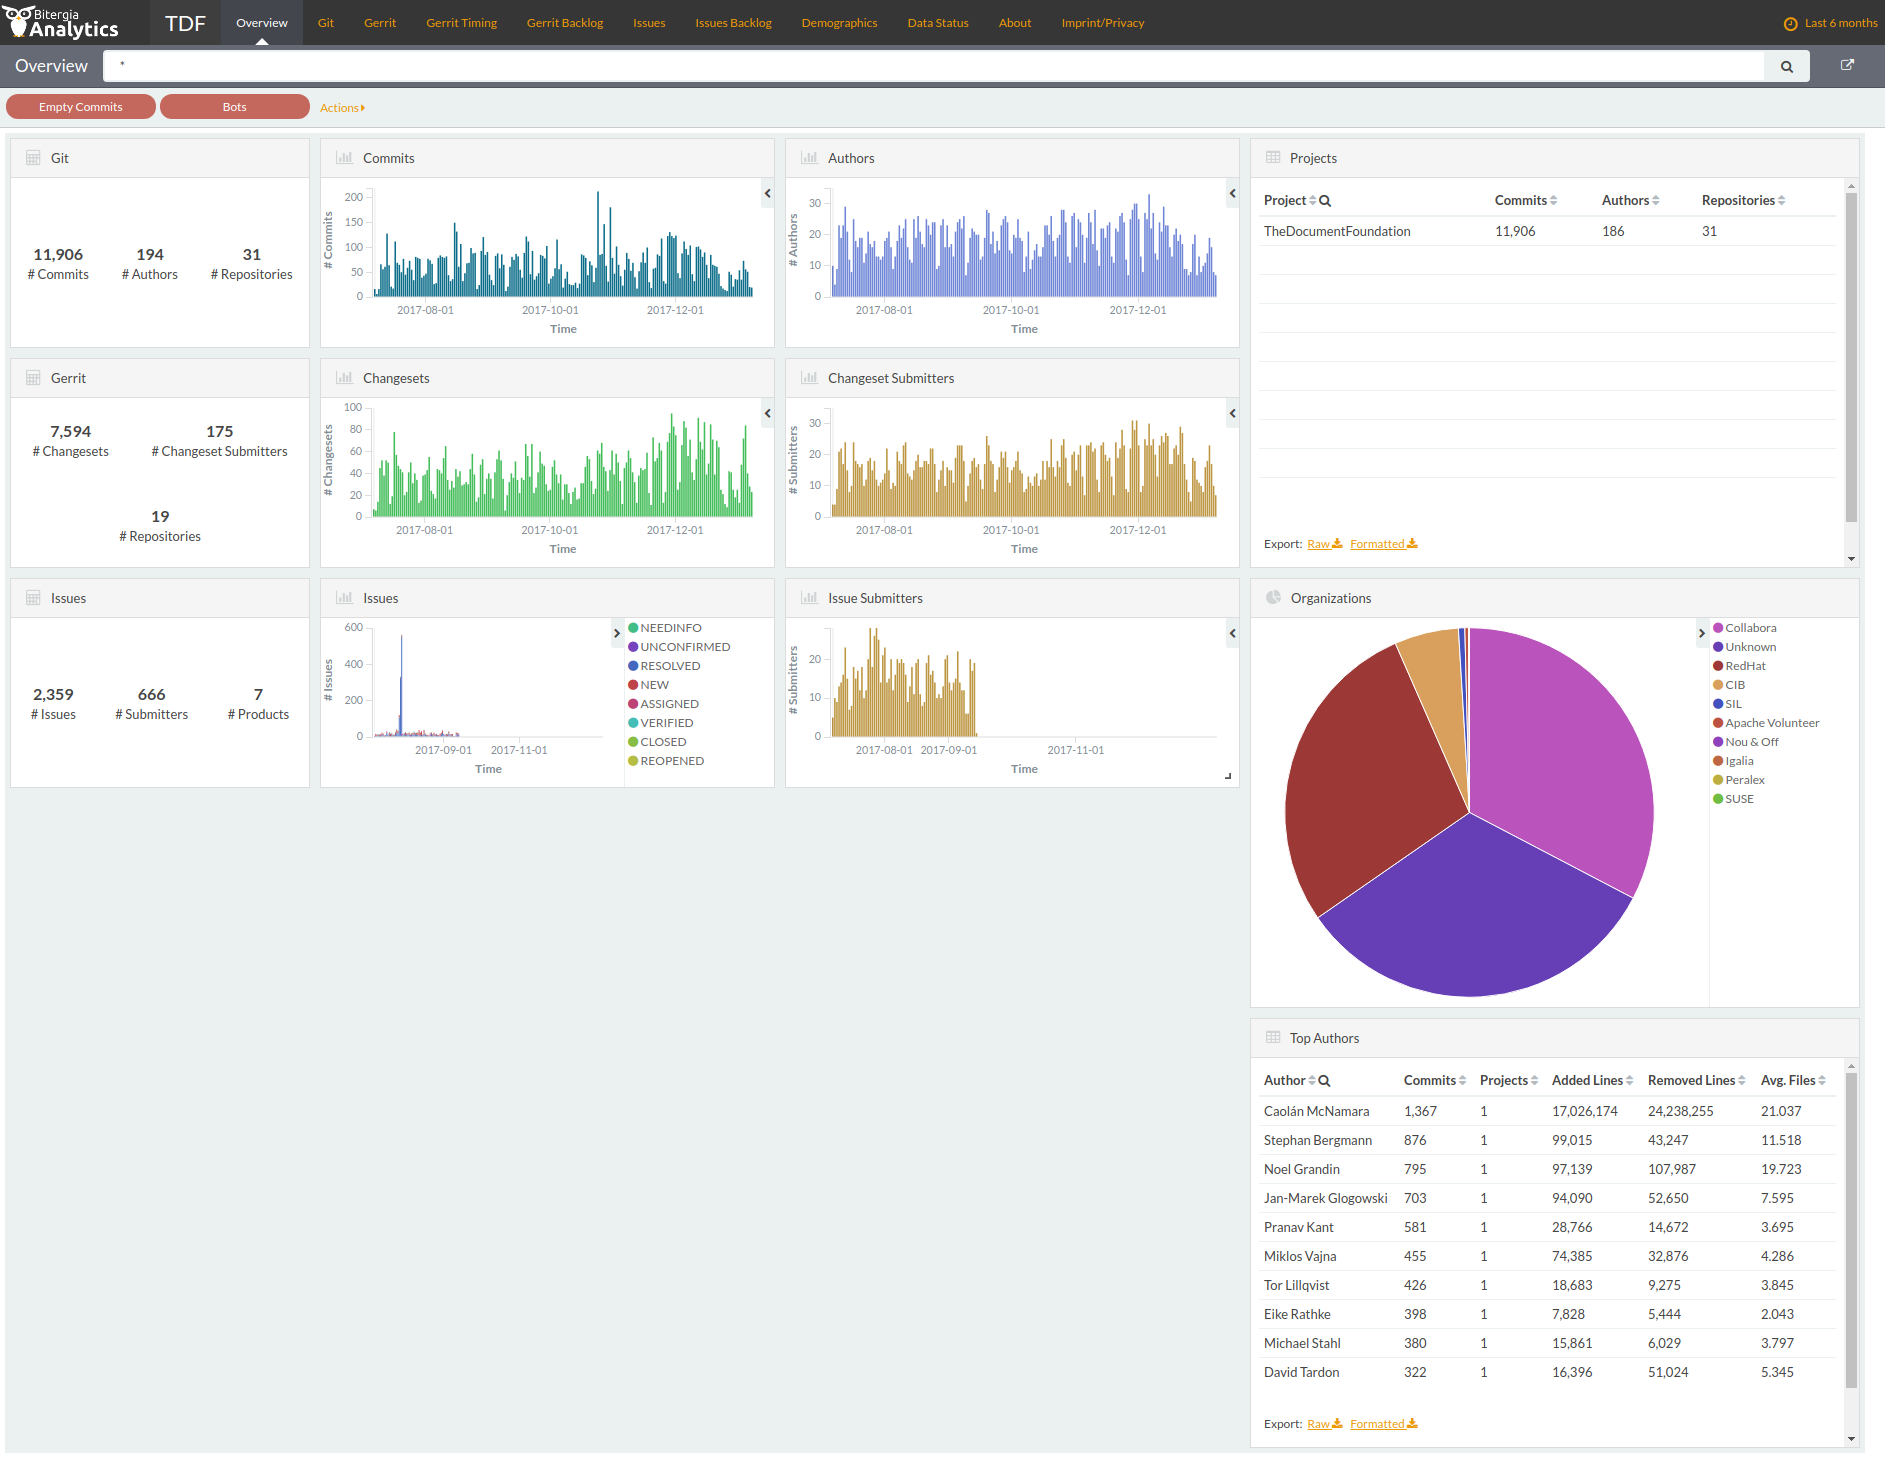
The following four thumbnails show the dashboard home configured for the following time intervals: 2 years, 1 year, 6 months and 90 days. They provide some interesting insights.